Threshold vs Forecast: How to Set Channel Validation Targets That Auto-Kill
The Most Common Failure Mode in Channel Decisions
The most common failure mode I see in channel validation conversations is the same conversation, restaged at three-month intervals, with new data and the same unresolved question. Marketing has spent another quarter on a channel. The CFO wants to know whether it is working. Marketing presents the metrics. The metrics are ambiguous. The conversation produces a decision to give the channel another quarter. The cycle repeats.
The failure is not the marketer’s lack of discipline. The failure is upstream of the conversation. It is in how the validation target was set in the first place.
When a target is framed as a forecast (the expected outcome the channel will produce if it works), every conversation about the channel becomes a debate about whether the forecast was reasonable, what is wrong with the inputs, and whether the model needs adjustment. The forecast frame invites endless relitigation because forecasts can always be revised. The kill criterion is implicit, undefined, and therefore never triggered.
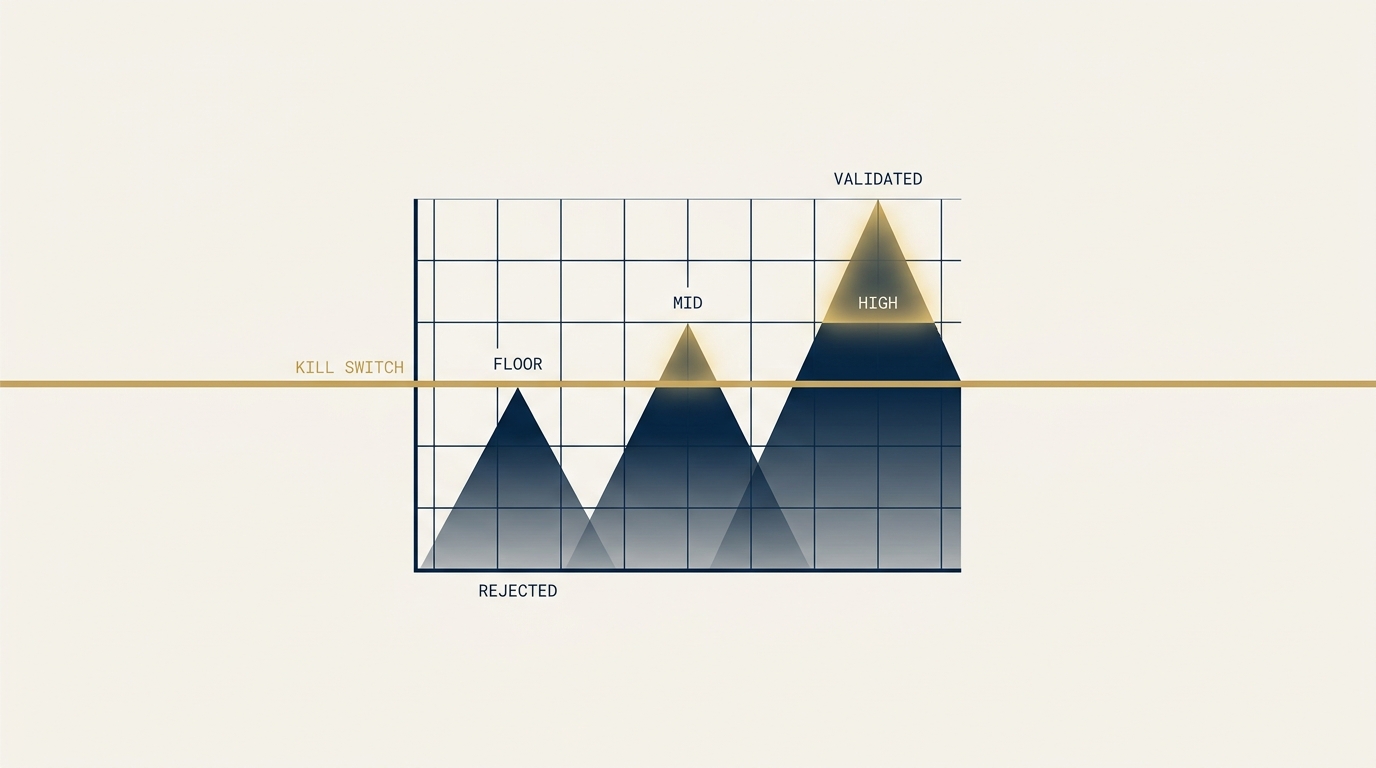
When a target is framed as a threshold (the minimum performance required for the channel to be worth scaling), the conversation becomes binary. The threshold was met or it was not. The kill criterion is explicit, defined in advance, and triggered automatically when the data lands.
Threshold framing is not just a measurement preference. It is decision architecture. It changes the conversation from “How are we doing?” to “Did we clear the bar?” and the second question terminates in a way the first one does not.
A Worked Example From a Channel Decision
The cleanest way to see the difference is to walk through a real channel-decision problem. A mid-sized financial-services firm we worked with was evaluating whether to invest in a paid acquisition channel against a Lifetime Value (LTV) ceiling that the firm’s economics could support.
The economics:
- Gross LTV per client: approximately $150,000.
- Customer Acquisition Cost (CAC) ceiling for profitability: $15,000, representing 10% of LTV.
- Risk-premium-adjusted CAC target: $12,000, with $3,000 reserved as the implicit risk premium against complete channel failure.
- Required cost per strategy call: $1,200 based on prior test data and the 2026 platform environment.
- Required close rate: 10%, derived from the math that $1,200 per call times 10 calls per close equals the $12,000 CAC target.
Both conditions had to hold. Cost per call below the target AND close rate above the threshold. If either missed, CAC exceeded the LTV ceiling. If both missed, the channel was unprofitable by a margin large enough that no operational tuning could recover it.
The forecasting frame on this problem would have produced a model with point estimates: “we expect cost per call at $1,400 and close rate at 8%, producing CAC of $17,500.” The model would have shown the channel as unprofitable, the conversation would have focused on whether the assumptions were correct, and the test would either have proceeded with disputed inputs or stalled in argument.
The threshold frame produces a different conversation. The math is presented as the minimum required for the channel to be worth scaling, not the expected outcome. The test is designed to settle whether the channel clears the threshold, not to validate a forecast.
Why the Math Is Binary
The viability table for this engagement looked like this:
| Close rate | Cost per call | Effective CAC | Profitable? | Margin of safety |
|---|---|---|---|---|
| 6% | $1,500 | $25,000 | No | -67% |
| 8% | $1,500 | $18,750 | No | -25% |
| 10% | $1,500 | $15,000 | Breakeven | 0% |
| 10% | $1,200 | $12,000 | Yes | +20% |
| 12% | $1,200 | $10,000 | Yes | +33% |
The channel was unprofitable across the entire empirically probable range based on industry research (6-9%) and only became profitable when both inputs cleared their targets jointly. A one-percentage-point close-rate miss translated to roughly a $1,400 per-client CAC variance. The math left no ambiguous middle ground. Either the channel cleared the threshold and the math worked, or it did not and the math broke.
This is the structural property that makes threshold framing useful. The math is symmetric. The minimum performance required for the channel to be worth running is the same number whether you call it a forecast or a threshold. The difference is what you do when the data lands.
The Industry Benchmark That Anchors the Threshold
The threshold was not arbitrary. It was anchored against the only primary-source close-rate benchmark in the public record for paid wealth-management lead generation. SmartAsset’s published methodology for its advisor referral platform discloses a 4% close-rate assumption based on data collected from partner advisors. Pure Financial Advisors, the most-cited paid-acquisition success case in wealth management, generated more than $1B in new AUM through this platform under that 4% close-rate assumption.
The 4% close rate is the industry baseline. A firm validating a paid acquisition channel at the 10% threshold is betting that funnel quality, salesperson fit, and pre-qualification rigor can produce 2.5 times the documented baseline.
This is achievable but at the upper edge of what B2B sales coaching and funnel optimization research documents as a realistic improvement range. Ebsta and Pavilion’s 2024 research on dynamic coaching correlated with a 19% improvement in win rates. Hyperbound’s 2025 data put top performers at roughly 1.5 times the B2B average win rate. The 2.3 times lift required to move from a 4.3% baseline to the 10% threshold sits at the upper edge of the empirical literature.
This is exactly the right context in which to frame the target as a threshold rather than a forecast. We are not forecasting that the lift will land. We are testing whether it does.
Cumulative Probability: The Honest Read on What We Are Betting On
Threshold framing forces a question that forecast framing tends to obscure. What is the joint probability that all the conditions required for the channel to work hold simultaneously?
For the engagement I described, the answer was approximately 15%, derived from three multiplicative conditions:
- Cost per call stays below the $1,200 target: approximately 70% probability based on prior test data, adjusted for the 2026 platform environment.
- Close rate lifts from the historical 4.3% baseline to the 10% threshold: approximately 30% probability based on the B2B coaching and funnel optimization literature applied to our specific salesperson and pre-qualification context.
- Both conditions hold across a sustained 12-month cohort rather than collapsing under audience saturation, ad fatigue, or platform policy changes: approximately 70% probability based on the documented platform restriction trajectory.
Multiplied: 0.70 times 0.30 times 0.70 equals 15%.
This number is not a marketing claim. It is the joint probability that the channel works at the threshold across a sustained operating horizon. The number is uncomfortable because it puts a single integer on the question executive sponsors typically ask in qualitative terms (“How confident are you?”), but it is more informative than the qualitative answer.
The 15% figure does what the forecast frame cannot. It makes the bet explicit. The expected case is that one or two of the three conditions hold and the channel produces marginal economics that do not justify scaling. The threshold case (all three hold) is the upside scenario, not the base case. The downside case (most conditions miss and the channel produces zero clients) accounts for the risk premium baked into the CAC target.
A team that walks into a six-month test cycle with a 15% threshold probability and a clear expected case is not going to spend month four arguing about whether the test was set up correctly. They will know what they are looking at when the data lands.
The Kill Switch as Automatic
The operational benefit of threshold framing is that it removes the most expensive decision in channel validation: the decision to stop.
Every marketer I have ever worked with knows the experience of a channel that has not validated and is unlikely to validate, where the conversation keeps producing decisions to give it more time. The reason is structural. Without a pre-committed threshold, every quarter’s data is interpretable as “trending toward validation.” With a pre-committed threshold, the data is binary. The threshold was met or it was not.
For the engagement I described, the test design used five sequential gates over six and a half months:
- G0: Launch readiness. Compliance review complete, tracking validated, landing pages live, creative approved.
- G1: Learning-phase exit at week 3 to 4. Channels have exited platform learning phase. Cost per lead within range. Minimum lead volume per channel met.
- G2: Cost-per-call validation at week 8 to 11. Hard decision gate. Cost per call below $1,500 sustained. Channels that fail this gate are terminated. Surviving channels receive concentrated budget.
- G3: Mid-cohort sanity check at week 16. Cumulative call volume sufficient. Preliminary close-rate signal directionally consistent with the threshold.
- G4: Cohort maturation decision at week 26. Binary scale-or-kill. Close rate at or above the 10% threshold equals scale. Below the threshold equals kill. No “hold zone” for ambiguous outcomes.
The G4 decision is the load-bearing one. Under the threshold framing, ambiguous outcomes (close rate landing in the statistically indistinguishable 6 to 9% band) trigger kill, not hold. The reasoning is that extending into a second confirmatory cohort would consume another nine months and another major budget commitment with no guarantee of resolving the ambiguity. The test was sized to settle the 4.3% baseline versus 10% threshold question. It was not sized to distinguish 7% from 10%. At a certain point you make the call.
This is the discipline threshold framing enforces. The kill criterion is explicit, the decision date is locked, ambiguity defaults to kill rather than to “give it more time.” The team is not punished for the channel underperforming because the channel was always going to underperform 85% of the time. The team is rewarded for the discipline of running the test cleanly and accepting the answer the data delivers.
Why This Beats “Give It More Time”
“More time” is the most expensive answer in channel validation because it has no terminal condition. There is no quarter’s data that will not invite the response “give it another quarter.” The marketer who insists on threshold framing at the outset is investing in the only mechanism that produces a binary terminal answer.
Three modes of “more time” objection are worth distinguishing:
- More time on the existing system. This is the weakest version of the objection. If the system has been operating long enough to produce data and the data is below threshold, more time on the same inputs at the same velocity produces the same outputs. The objection fails the empirical test.
- More time after the documented gaps are fixed. This is the strongest version. If the test has surfaced specific operational issues (poor salesperson fit, weak landing page conversion, attribution opacity), fixing those issues is a defensible reason to extend. The disciplined version pre-commits the fix list and a second-cohort threshold, then reapplies the kill criterion at the new gate.
- More time at the structural-compounding level. Some channels (organic search, named-byline placement, conference circuit) compound over horizons longer than a six-month test cycle can resolve. For these channels the question is not “Did the threshold clear?” but “Is the trajectory consistent with the compounding model?” The threshold framing still applies but the threshold variable is trajectory rather than absolute outcome.
The first mode does not survive the data. The second mode is defensible with discipline. The third mode is a different question entirely and should be scoped as a separate decision.
For PPC, paid social, and most direct-response channels, the second and third modes do not apply. The performance window is short. The economics are visible within a quarter. The threshold framing is the right tool.
The Implication for Channel Investment
The strategic implication for any organization evaluating channel investments is that the framing decision precedes the budget decision. Decide whether you are forecasting or thresholding. Then design the test accordingly.
Forecasting framing is appropriate when the channel is established, the variance is well-understood, and the question is operational optimization rather than viability. Should we increase budget? Should we reallocate across sub-channels? Should we shift creative mix? These are forecasting questions.
Thresholding framing is appropriate when the question is viability. Is the channel worth scaling at all? Should it be terminated? Should we run a structured test to settle a multi-quarter argument? These are thresholding questions.
Most channel investments at most organizations are viability questions disguised as operational questions, because the team has been running the channel long enough that it feels established but has never produced data that clears a clean threshold. The disguise is what produces the perpetual quarterly relitigation. The solution is to convert the question back to the form that matches the underlying decision: this is a viability question. Set the threshold. Run the test. Accept the answer.
The marketers I have seen produce the strongest results in channel decisions are not the ones with the most accurate forecasts. They are the ones who set the cleanest thresholds and committed to the kill criteria they wrote down before the test began. The forecasting skill is real. The thresholding discipline is rarer and produces more decision value per unit of work.
About the Author
Andrés Plashal
Author of the Assistive Agent Optimization (AAO) framework. Twenty years building search and measurement systems for B2B and SEC-regulated firms. Google Partner since 2017.
Credentials: UIUC Gies College of Business (Behavioral Science), Columbia College Chicago (Interactive Arts & Media). Member: American Marketing Association, GAABS, Paid Search Association. Published researcher (SCTE/NCTA).